The last time we dedicated a Chart Of
The Day and Tumblr post to the Reuters/Jefferies Commodity Research
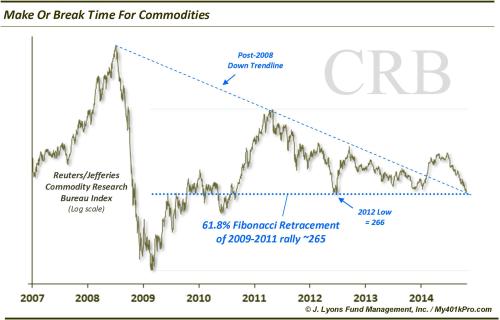
Bureau Index (CRB) was October 30, 2014. In a post titled It’s Make Or Break Time For Commodities, we noted that the CRB was “at a potential make or break point for those investors looking for a resumption of the commodity bull market.” The
rationale was that the index was testing some key levels on its chart
around the 265 area, most notably A) the 61.8% Fibonacci Retracement of
the 2009-2011 rally, B) the June 2012 lows and C) the top side of the
post-2008 down trendline, broken earlier in the year. Here is the chart
from that post.
image: http://40.media.tumblr.com/7d99deaa740fd4c0d1355f5f6894dada/tumblr_inline_nsiu39131I1sq14jh_500.jpg
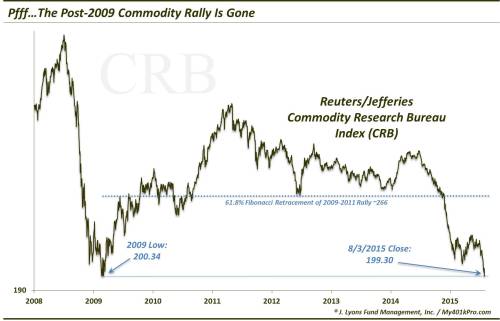
That 265 level proved to be up to the task…for a month. On November
28, the CRB Index gapped down below the 265 level by 3% and has not
looked back since. Verdict: Break.
Why do we bring it up today? Well, we ended that October post with this:
“…should this key level fail to provide support for
the CRB, it opens the index up to further (perhaps significant)
weakness. It would also cast a doubt on the likelihood of resuming the
commodity bull market any time soon.”
Significant weakness did indeed follow and today the CRB reached a dubious distinction. It closed below it’s lows from 2009.
image: http://41.media.tumblr.com/a48c3aac3061f2ba2ec937df88342af0/tumblr_inline_nsizexpbhC1sq14jh_500.jpg
With the CRB, and many of its components, hitting or violating their
2008-2009 lows, we can pretty much stick a fork in the post-2009
commodity cyclical bull market. But what of the commodity secular
“supercycle” that began around the turn of the century? Believe it or
not, it may be premature to pronounce that over as well. No, the lower
highs and lower lows now evident on the chart do not bode well. However,
if the CRB can avoid too much more damage, it may be able to keep the
possibility open the the secular bull remains intact, though bloodied.
One level, in particular to watch is the 194 level, which represents
the 78.6% Fibonacci Retracement of the 1999-2008 rally. If the index can
hold there, and bounce back above the 200 area, it could reasonably be
considered a double-bottom/re-test/hold of the 2009 lows. That does not
give the CRB room to go much lower, however.
The secular cycle’s fate will likely be determined by the energy and
metals complexes which account for roughly 36% of the index. For, as
badly as they have been beaten down, the other commodities, namely the
grains and softs, have fared even worse. With the recent downside
acceleration in energy and metals, it certainly doesn’t “look” good
there. However, a case can definitely be made for a bottom there
sometime soon. Sentiment and price action are about as washed out as
they can be at the moment. And while the current downside move could
certainly cascade further in the near-term, it could possibly be a
capitulatory/exhaustive type move.
Perhaps then, commodity bulls can begin to finally reap some gains
again. But for now, the gains from the 2009 low, like Keyser Soze, are
gone.
No comments:
Post a Comment