The Labor Force Participation Rate is lower than the rate during the Great Recession for all age groups except those 55 years and older.
The percentage of women attached to the labor force continues to decline.
In February of this year we noted that the job recovery was a farce. We reviewed the job market through the lens of the overall labor force participation rate and that rate by age group.
Last week the Bureau of Labor statistics released its non farm payroll (NFP) report for October. The report showed 271,000 new jobs created surpassing expectations by about 90,000. The unemployment rate was reported to be at just 5%.Reuters called the October NFP report “blow out jobs growth”
The main stream financial media and wall street traders (and algos) only look at the headline NFP and unemployment numbers, rather than also looking at what type of jobs were supposedly created and who got or lost them.
Many critize the NFP report in that it is not a measure of actual jobs created but rather relies on a survey that uses assumptions that some believe are faulty (the numbers are based on birth/death assumptions with no proof that any jobs were actually created). This leads to charges that the NFP numbers can easily be manipulated.
The unemployment rate is also criticized for how it is calculated. If one is not considered in the labor force, the Bureau of Labor Statistics does not include them as “unemployed”. Therefore, if the laor force participation rate drops, the unemployment rate can also drop.
The analysis below assumes that even if the NFP numbers are extremely accurate, the job market is still poor. As a result of a poor jobs market, the real estate market, as measured by existing and new home sales, is also sub par.
Non Farm Payroll Three Month Average Lowest of the Year/Lower Than Last Year
The last two months NFP numbers (August and September) were low and only revised slightly higher in the October NFP report. The three month average NFP reports covering August-September 2015 is about 187,000 new jobs created, lower than any three month period of this year and lower than the comparable three month period of last year.
Type of Jobs Created in October
The jobs that the NFP October report showed were mostly all part time and low paying jobs.
Education and Health: +57K
Professional Business Services/Temp Help: +54K
Retail Trade: +44K
Leisure and Hospitality: +41K
Temp Help: +25K
Manufacturing workers: +0
Mining lost workers
The Labor Force Participation Rate
The Song Remains the SameThe labor force participation rate identifies those people who have jobs as a percentage of the population. Since February of 2015, when we last examined the state of the jobs market, the labor force participation rate has not improved, despite the “robust” job reports.
Civilian Labor Force Participation Rate
The general labor force participation rate in October 2015 was unchanged from February 2015 and at levels last seen in 1978 when women had not full entered the labor force.The persistently low labor force participation rate is not a function of retiring baby boomers leaving the labor force. (see labor force participation rates of those 55+ years and older and 65+ year and older below)
Labor Force Participation Rates 1978 – 2015
October 62.5% February 62.5%May 1978 62.6% July 1997 68.1%
Labor Force Participation Rate 1978-2015
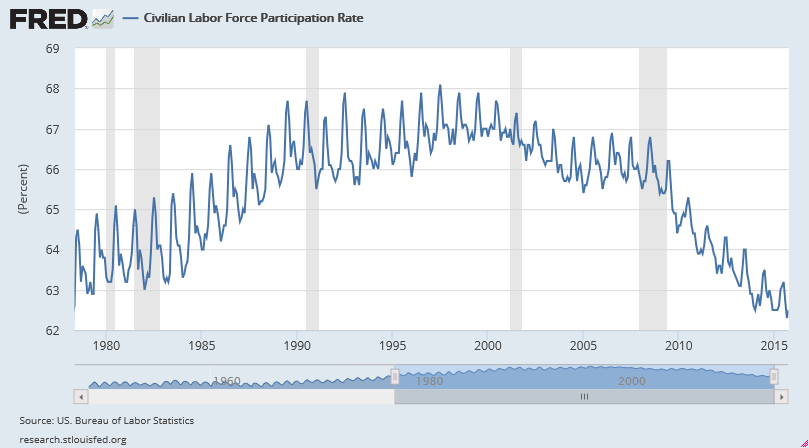
Source: US. Bureau of Labor Statistics, Civilian Labor Force Participation Rate [LNU01300000], retrieved from FRED, Federal Reserve Bank of St. Louis, November 6, 2015.
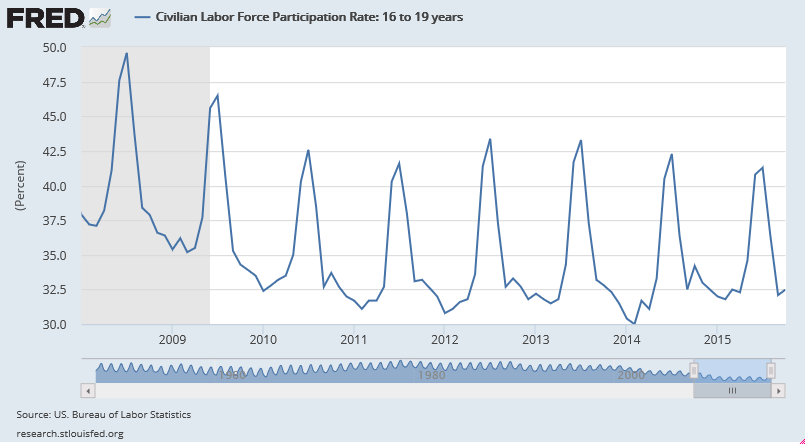
Labor Force Participation Rate 2008-2015 Among 16-19 Year Olds
Up slightly since FebOctober 32.5% February 31.8%
July 1978 71.8% January 2014 30.4%
Slightly less than a third of those aged 16-19 were working in October 2015. In the summer of 1978, nearly three quarters of those aged 16-19 were working. In 2000 more than 50% of those aged 16-19 were attached to the labor force.
In October 2015, the percentage of those aged 16-19 attached to the labor force declined to levels lower than those at the height of the Great Recession.
Labor Force Participation Rate 1948-2015 Among 16-19 Year Olds
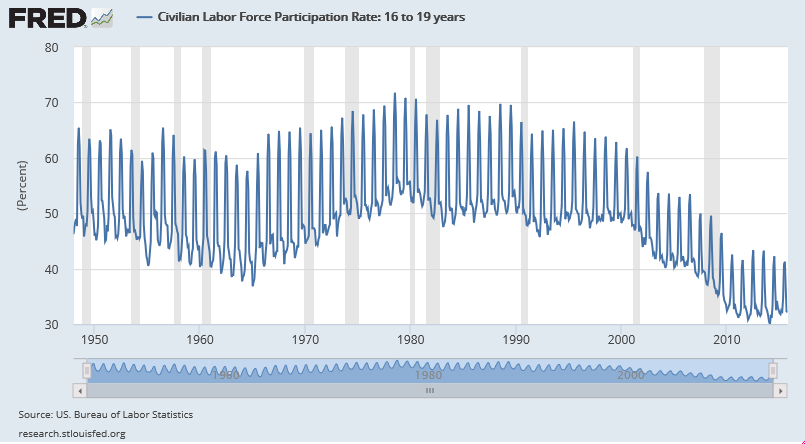
Source: US. Bureau of Labor Statistics, Civilian Labor Force Participation Rate: 16 to 19 years [LNU01300012], retrieved from FRED, Federal Reserve Bank of St. Louis, November 6, 2015.
Labor Force Participation Rate 2008-2015 Among 20-24 Year Olds
Up slightly since FebruaryOctober 70.7 February 70.0%
July 1989 83.8% January 1954 58.5%
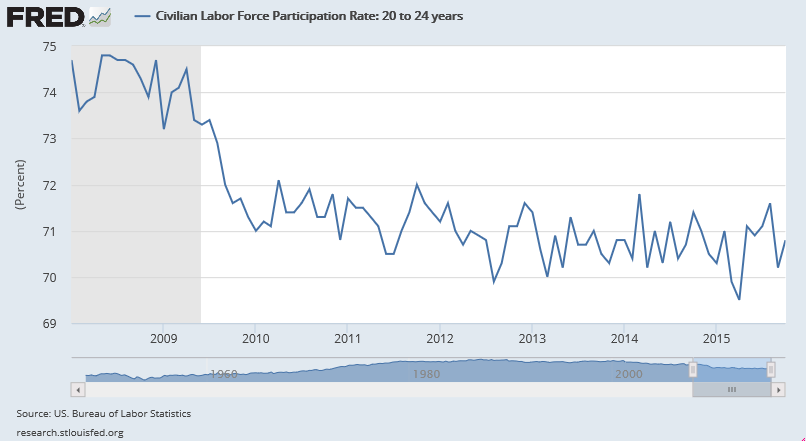
Labor Force Participation Rate 1948-2015 Among 20-24 Year Olds
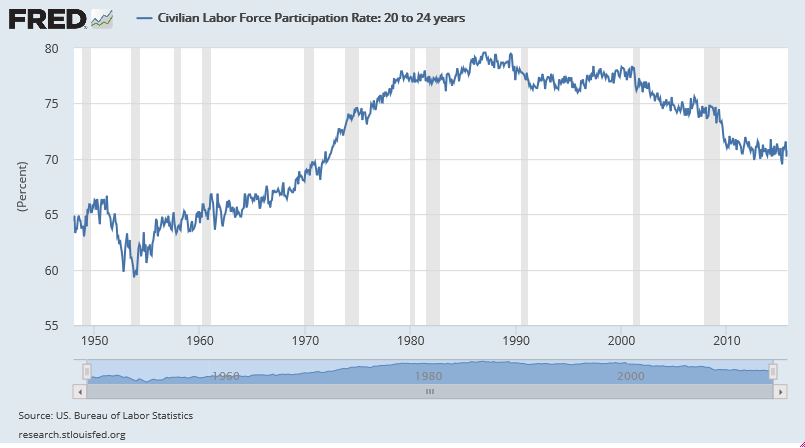
Source: US. Bureau of Labor Statistics, Civilian Labor Force Participation Rate: 20 to 24 years [LNS11300036], retrieved from FRED, Federal Reserve Bank of St. Louis November 6, 2015.
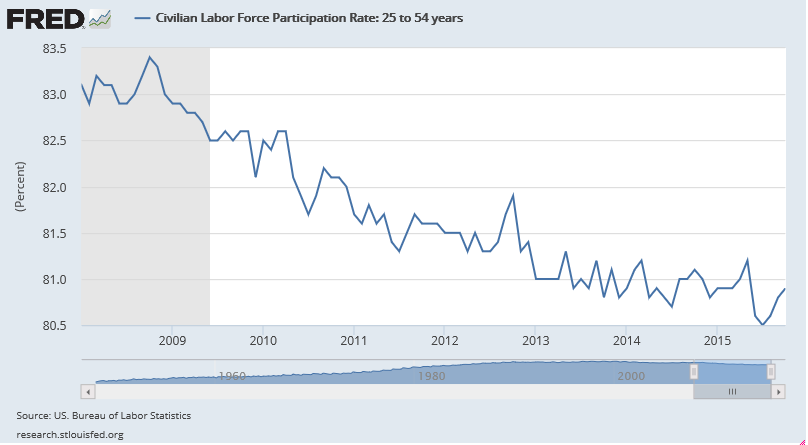
Labor Force Participation Rate 2008-2015 Among 25-54 Year Olds
October 80.9% February 80.9%May 1978 76.7% March 2000 84.5%
Labor Force Participation Rate 1978-2015 Among 25-54 Year Olds
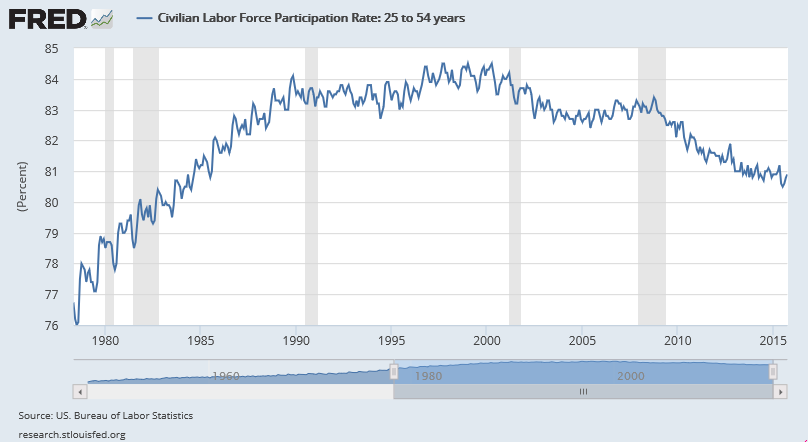
Source: US. Bureau of Labor Statistics, Civilian Labor Force Participation Rate: 25 to 54 years [LNU01300060], retrieved from FRED, Federal Reserve Bank of St. Louis, November 6, 2015.
The Myth of Retiring Baby Boomers
Labor Force Participation Rate 2008-2015 Among Those 55 Years and Older
UP since FebOctober 40.0 % February 39.9%
May 1956 44.0% July 1993 28.9%
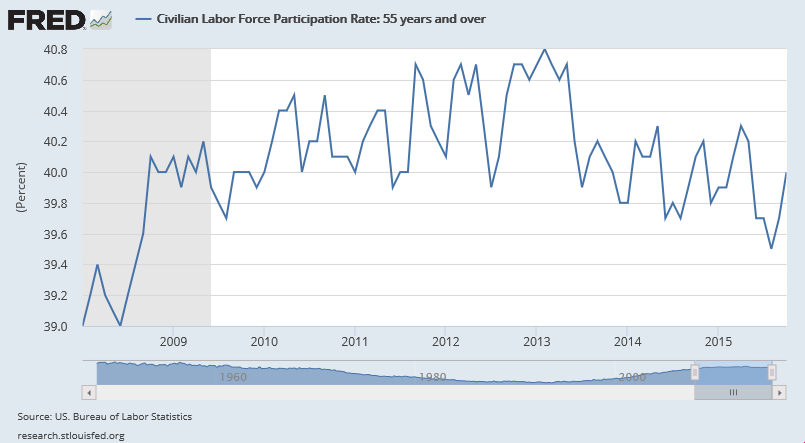
Early retirement started to die around 1990
Labor Force Participation Rate 1948-2015 Among Those 55 Years and Older
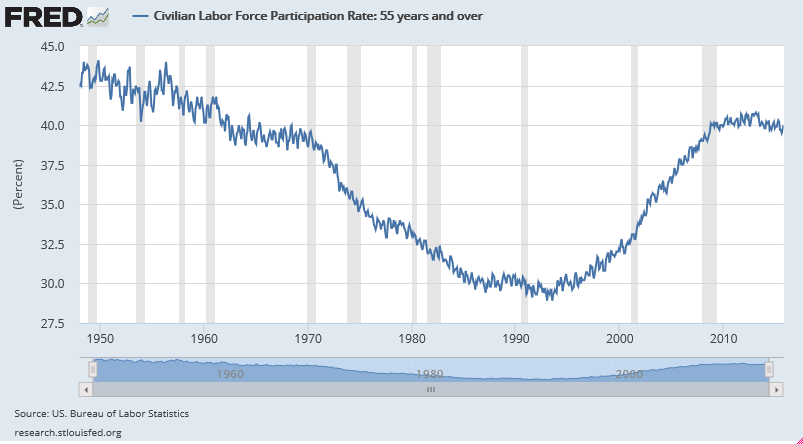
Souce: US. Bureau of Labor Statistics, Civilian Labor Force Participation Rate: 55 years and over [LNU01324230], retrieved from FRED, Federal Reserve Bank of St. Louis, November 6, 2015.
Labor Force Participation Rate 2008-2015 Among Those Aged 65 and Older Without Disabilities
UP since Febfewer working at height of recession, near the highest since they started keeping stats
October 24.3% February 23.9%
December 2008 21.4% May 2013 24.4
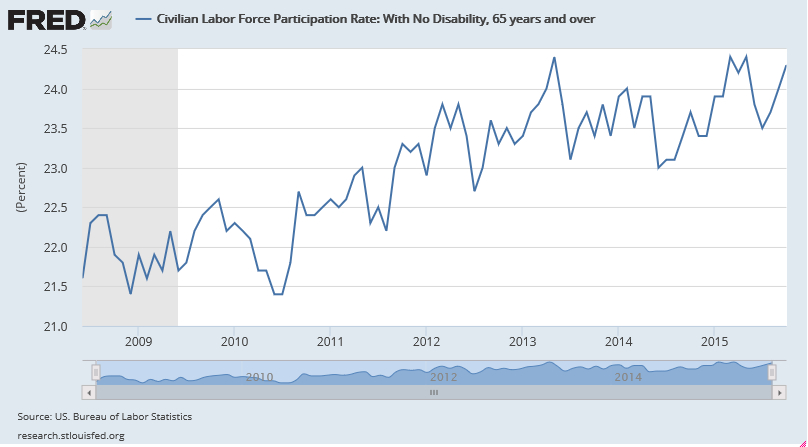
No data prior to 2008- assumption by that age nearly all were retired or had died
Source: US. Bureau of Labor Statistics, Civilian Labor Force Participation Rate: With No Disability, 65 years and over [LNU01375379], retrieved from FRED, Federal Reserve Bank of St. Louis, November 8, 2015.
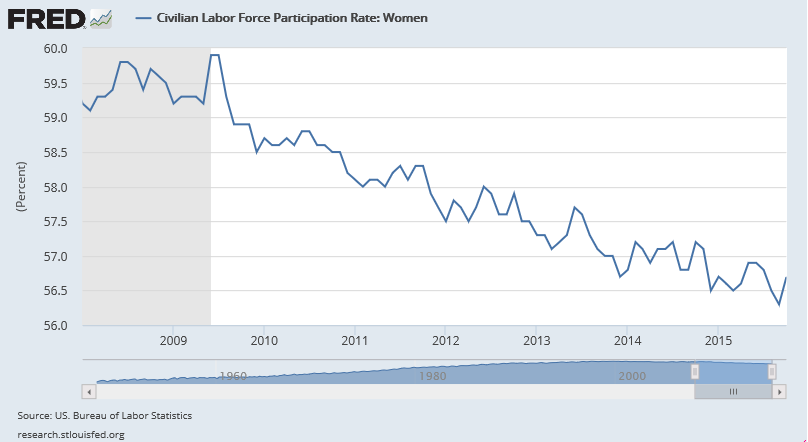
Labor Force Participation Rate 2008-2015 Women
October 2015 56.7% February 2015 56.6%
Jan 2008 59.2% June/July 1999 59.9%
July 97/June 97 60.4%
January 1948 30.7%
Labor Force Participation Rate 1948-2015 Women
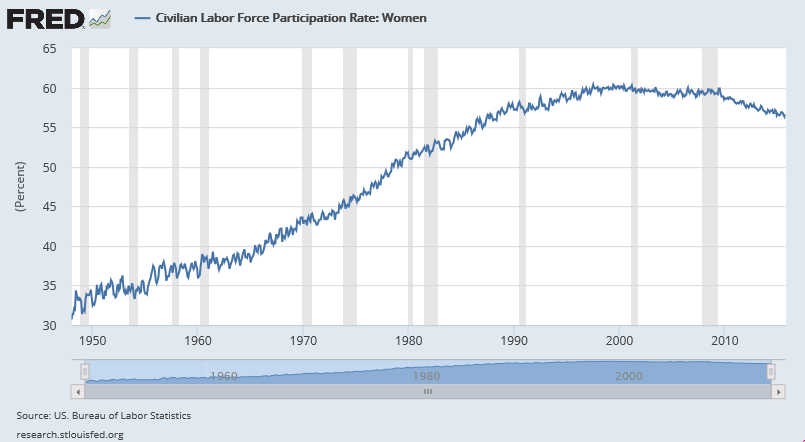
Source: US. Bureau of Labor Statistics, Civilian Labor Force Participation Rate: Women [LNU01300002], retrieved from FRED, Federal Reserve Bank of St. Louis, November 6, 2015.
The result
proofthatQE ZIPR monetary policy worked
Confirmatry data- they wil raise rates but only so they can lower them again-Janet Yellen Negative interest rates, cashless society
three legged propaganda stool
https://smaulgld.com/sturdy-non-farm-payroll-numbers-provide-the-fed-with-cover-to-raise-interest-rates/
No comments:
Post a Comment