How the government deceives us on inflation, as housing costs soar.
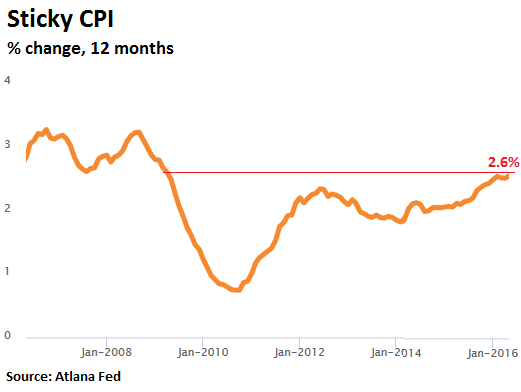
For inflation lovers, the headline numbers that the Bureau of Labor Statistics reported today was benign: The Consumer Price Index for All Urban Consumers (CPI-U) rose 0.2% in May, seasonally adjusted. Over the last 12 months, not seasonally adjusted, the index rose 1.0%.The Atlanta Fed’s “sticky-price” CPI – “a weighted basket of items that change price relatively slowly,” as it says – wasn’t quite that benign. It rose 2.6% for the 12-month period, the hottest increase since April 2009!
So prices are rising. Not that
this is a surprise to anyone trying to make ends meet on a monthly
basis. But now even the official numbers are beginning to limp behind
reality.
The report by the BLS had a mix of rising and falling prices. Energy
got more expensive. The price of oil has jumped since February, and so
the price of gasoline rose 2.3% in May, seasonally adjusted, after
having soared 8.1% in April. Without seasonal adjustment, it jumped 6.6%
in May. Fuel oil jumped 6.2%, natural gas rose 1.7%, electricity edged
down 0.2%. But the energy index is still below last year with gasoline
down 16.9%. So yes, energy prices are rising, but they’re still down
from a year ago.That cannot be said of rents.
The Consumer Price Index contains two housing components: “Owners’ equivalent rent of primary residence” (OER) and “rent of primary residence” (Rent). They purport to measure the cost of “Shelter,” which is the “consumption item” that a home provides and is thus included in the CPI. The cost of the home itself and any improvements to the home are considered an “investment,” not consumption, and therefore not part of the CPI.
“Owners’ equivalent rent” accounts for 24.2% of total CPI. “Rent of primary residence” accounts for 7.7% of CPI. Combined they account for 31.9% of CPI. “Shelter,” which adds those two and some other items, accounts for 33.2%, by far the largest and most important component of the CPI.
The data are obtained by survey. For “owners’ equivalent rent,” homeowners are asked what they think they would have to pay if they were renting the home. A measure of implicit rent. Would homeowners think that rents of their types of homes are increasing? Nope. They’re not renting. They have no idea. They can easily fool themselves.
Based on the surveys, the BLS figured the “owners’ equivalent rent” rose 3.3% year over year. That measure accounts for 24.2% of CPI. It is always ludicrously low. It’s the simplest way of hiding the impact of soaring housing costs, and the simplest way of keeping CPI artificially low.
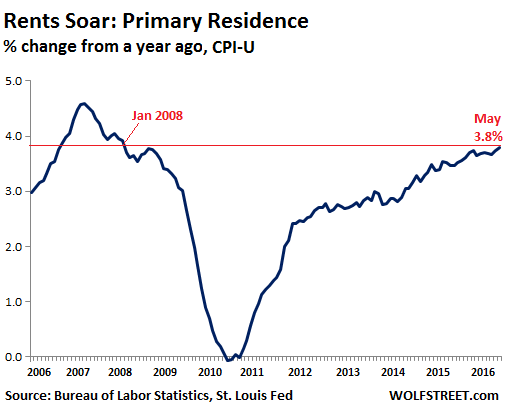
For the component “rent of primary residence,” renters are asked what they’re currently paying in rent. Even if they’ve lived in a rent-controlled apartment for 20 years and pay just a fraction of market rent, it becomes part of the statistics, and not the rent that a new renter pays. Market rent data is available everywhere. But no. So “rent of primary residence” – however understated it may be – rose 0.4% from April and 3.8% from a year ago, the biggest year-over-year increase since January 2008:
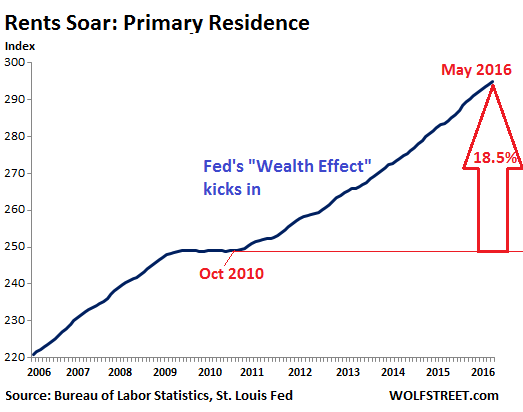
Over the longer term? In the five-and-a-half years since September 2010, the index for rent, understated as it is, has risen 18.5%:
Why are rents rising sharply when incomes, especially for the lower 80%, have languished? It’s not like renters have more money to blow on rent and thus are driving up rents. On the contrary.
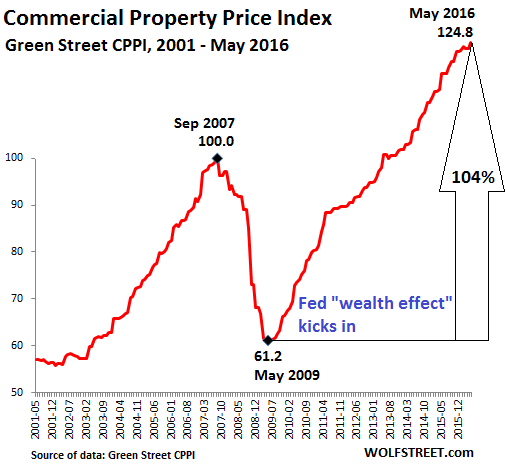
Since the Fed began its ZIRP and QE programs with the express goal of inflating asset prices, stocks and bonds have soared, home prices have soared, commercial real estate has soared, including apartments. Nearly all asset prices have soared. According to the Green Street Commercial Property Price Index (CPPI), commercial real estate prices have more than doubledsince May 2009, when the Fed’s “wealth effect” started to kick in:
People don’t have to live in stocks and bonds, and those asset bubbles have little impact on the daily lives of regular folks. But they do live in homes.
But when apartment prices, along with the rest of commercial real estate, began to soar, landlords raised rents, on the essential logic of cap rates and return on investment. It has to work out for the investor, or else the whole over-leveraged house of cards comes tumbling down again, as it did in 2008.
Housing costs is where the Fed’s “wealth effect” is eating the lunch of regular folks. More than just their lunch. They’ve gotten hammered by the Fed’s policies. Just like savers, who’ve done the prudent thing all their lives, only to watch their income streams get confiscated.
Rents started rising in late 2010, according to the BLS. The commercial real estate boom had started 9 months earlier. The lag is natural. And rent inflation, as figured by the BLS, hasn’t been nearly as steep as commercial property price inflation, for two reasons: One, because the BLS systematically understates rent inflation. And two, because reality bites; renters can be squeezed only so far before there’s nothing left to squeeze.
For many renters, it’s a zero-sum affair: every dollar spent on rent is a dollarnot spent on other items. In this way, rent inflation is a transfer of spending from healthcare, food, or electronic gadgets, to shelter. It’s not helpful for the overall economy. And it’s devastating for the people who have to struggle with it.
Sooner or later, with wages stagnant for many renters, market resistance starts kicking in. And this may now be happening in the first few cities, and a mega-landlord is preparing for a downturn. Read… It Starts: Apartment Glut in San Francisco & New York City
No comments:
Post a Comment